Implications of Government Action on the Digital business economy | A Case Study on the Jamaican Economic and Innovative Environment
This scientific article aims to open the conceptual ideologies relating to the impact of the governmental regulative framework on the development of the digital business environment. The paper explores the possible correlations and level of significance between the development of an innovative economic systém through the measure of the Global Innovation Index (GII) and the relatedness of government regulative actions through the Regulatory Quality Index (RQI) and the Government Effectiveness Index. The paper validates the established hypothesis by applying the Pearson Correlation Coefficient and the Multiple Regression Analysis statistical frameworks.
Research question:
Does Government regulatory action drive the development of the digital business economy?
At the dawn of the digital revolution, businesses struggle to evolve at a rate equivalent to new and emerging technologies. Consequently, globalization and market competition transcends the essential characteristics of basic business models and forces disengaging and unwilling businesses to fail at the hands of innovation. How can companies transform to match the ever-changing digital marketplace? What are the drivers that push the adoption and integration of technology, and what is necessary for encouraging adoption? On this premise, the research proposes understanding the impact of government action on the development of the digital business environment. This analysis explores a case study analysis of the Jamaican Innovative and Economic environment and the quality of government actions. There have been studies on the overarching topic by Hanna (2018), Chen et al. (2021), Vukoszavlyez (2019), and Xanthopoulou and Plimakis (2021), which determine that governments factors and actions influence the adoption of the digital economy through digital transformation by creating engaging regulative frameworks. However, notable in their approach, the process is primarily founded on a mix of qualitative and theoretical understanding of literature.
Interiguingly, Hanna (2018) highlights critical ideas relevant to understanding the overall research. The author refers to nurturing a digital transformation environment. Here, the authors assimilate governments must create an atmosphere conducive to supporting the digital ecosystem for development (see figure 1). In the study, Hanna (2018) explains that the ecosystem for digital transformation and the digital economy rests within the interconnectivity among Information, Communications, and Technology (ICT) infrastructure, Policies and Institutions, Human Capital, and ICT industry. Through these sub-systems, governments enable, coordinate and synergize the digital ecosystem. Provide opportunities to develop skills necessary to engage in the adoption and integration of the digital revolution and ICT industries that can adapt to technological changes in the global environment. The author also highlights that government should provide the digital infrastructure necessary to facilitate affordable communication infrastructure that encourages use.
Figure 1
Digital Transformation Ecosystem
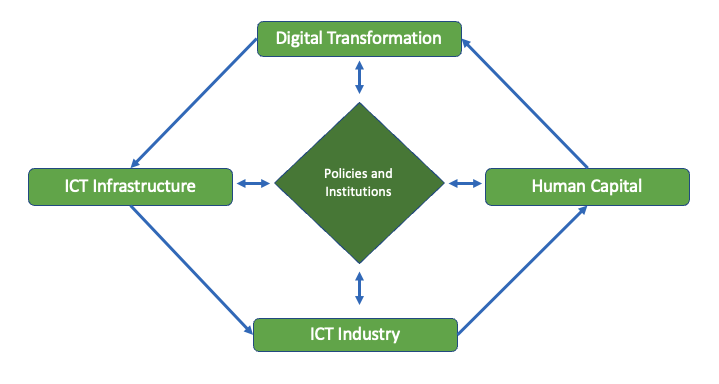
Notes: Adapted from A role for the state in the digital age by Hanna H. 2018. Journal of Innovation and Entrepreneurship.
Concurently, Hanna (2018) idealizes the conceptual framework of influence by the government in the role to encourage the adoption, use, and integration of digital commerce (e-commerce) within a country and the diffusion design (see figure 2). Here the author emphasizes the need to build innovative digital economies that cater to the technological revolution. The governments are the springboard for new technologies and human skills in research and development. Hanna (2018) also purports that governments promote competition through innovation and procurement. Governments must act as pioneers in the innovative landscape to guide economic activity; for example, the author mentions the increase development of digital identification systems in countries like India, Jamaica, and Barbados, which in retrospect would lay the foundation for future digital application in the digital economy. The ideas of Hanna (2018) and Chen et al. (2021) add credence to the primary research focus and further understanding and exploration of the topic.
Figure 2
Factors impacting the digital transaction ecosystem
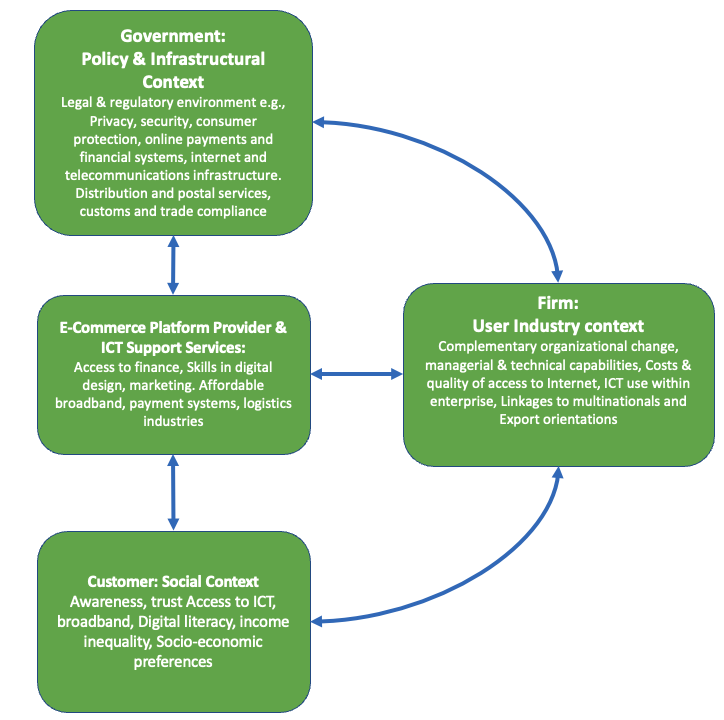
Notes: Adapted from A role for the state in the digital age by Hanna H. 2018. Journal of Innovation and Entrepreneurship.
Lastly, Hana's (2018) leadership theory from the lens of governments adds value to the research because it highlights the active management process through public policy. As governments act as catalysts to developing digital economies (ecosystems), laws must be in place to govern its growth and adoption (see figure 3). Notwithstanding the ideologies of other authors on the topic, the government must strengthen relationships through collaborations, inclusive digital environments, and capabilities.
Figure 3
Data ecosystem
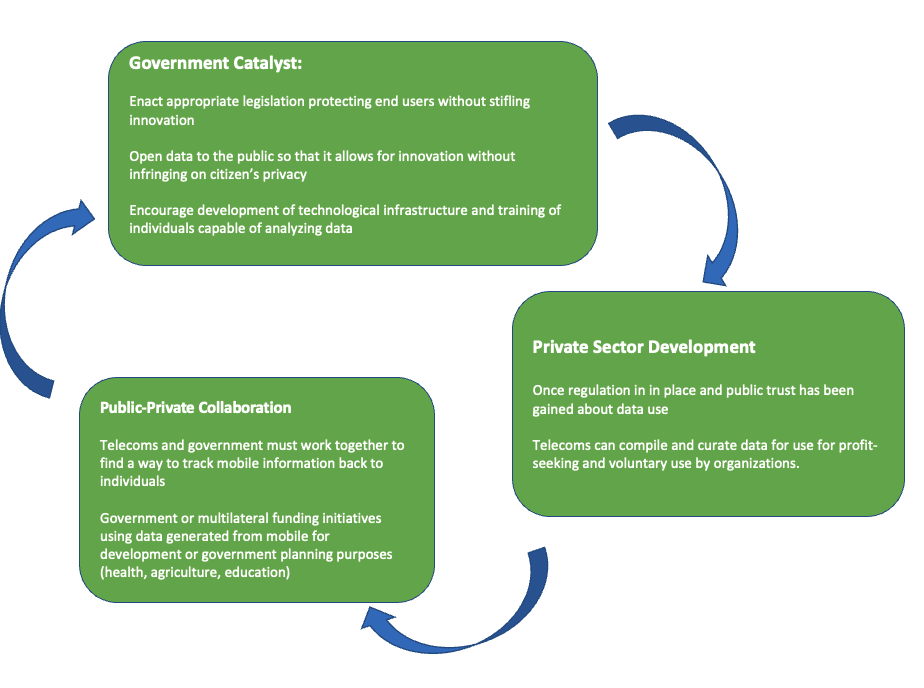
Notes: Adapted from A role for the state in the digital age by Hanna H. 2018. Journal of Innovation and Entrepreneurship.
The scope of this issue defines how governments enhance the transition toward digital transformation of the business environment. To effectively grasp the concept of the innovative environment, it is vital to understand the framework upon which growth and development are determinable. The Coronell, INSEAD, and WIPO (2020) provide a holistic framework for the Global Innovation Index (GII) that feeds the scientific basis for analyzing the development of the Jamaican digital and innovative environment (see figure 4 and 5).
Figure 4
Global Innovation Index Framework
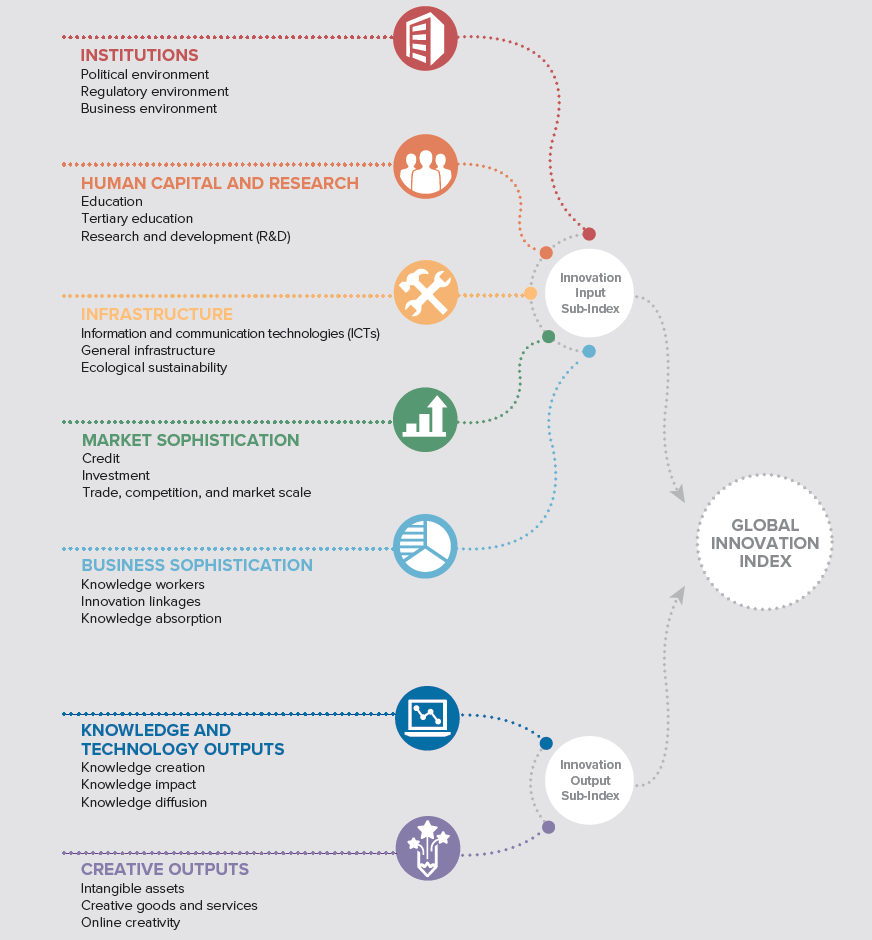
Notes: Apodted from Global Innovation Index report. 2020. Cornell, INSEAD, and WIPO.
The Global Innovation Index by nature is not the only measure for the global innovation status of economies but is by far the most holistic. WIPO (2020) explains that the Global Innovation Index (GII) ranks innovative ecosystems given a consortium of eight (80) sub-indexes to provide a standing that is scientifically comparable across one hundred thirty-one (131) nations from zero to one hundred (0:100) then a subsequent rank among results.
Figure 5
Global Innovation Index 2020: Jamaica's Innovation Ecosystem
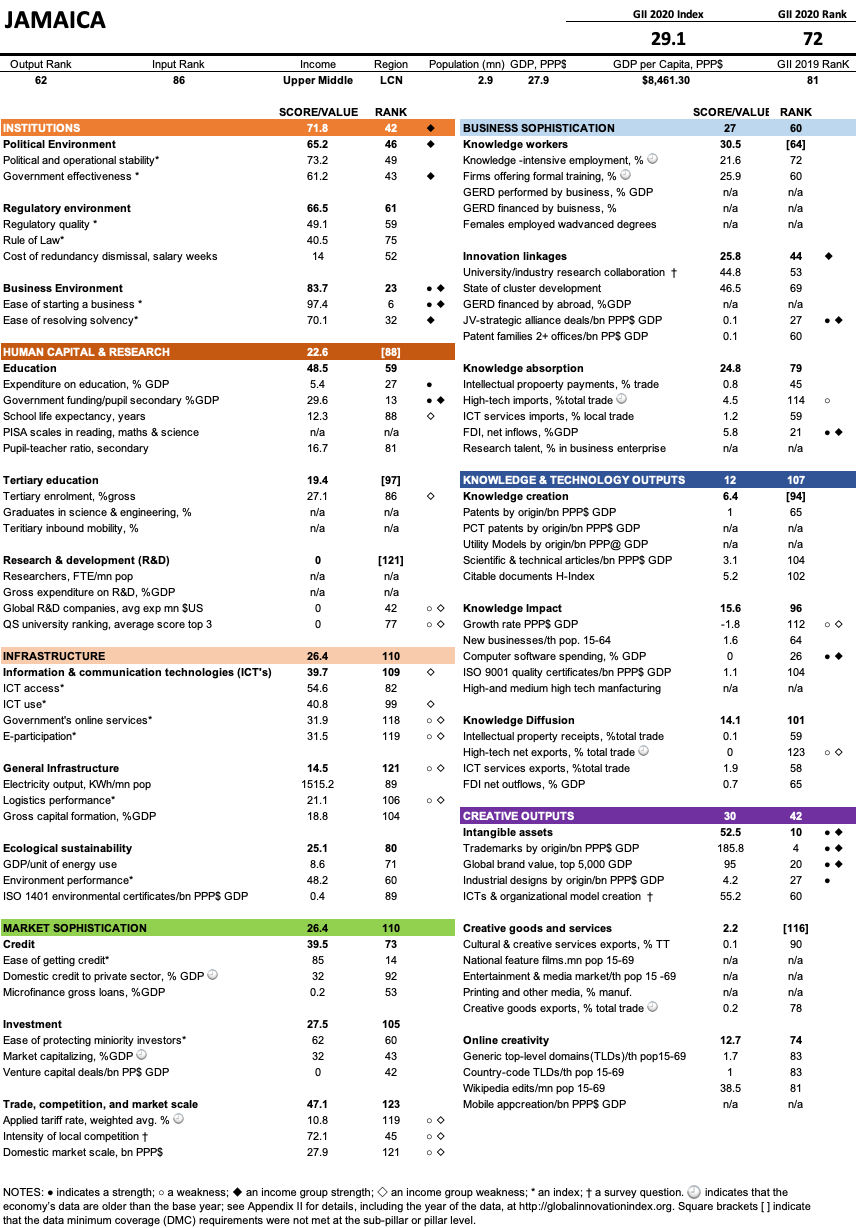
Notes: Apadted from Global Innovation Index report. 2020. Cornell, INSEAD, and WIPO.
Methodology
This research employs a two-step scientific, statistical model to solve the research problem. It applies the Pearson Correlation Coefficient calculation and the Multiple Regression Analysis of the World Intellectual Property Organization's Global Innovation Index (GII) against the World Governance indicator, Regulatory Quality Index (RQI), and the Governance Effectiveness Index from the World Bank of the Jamaican economy. The data is comparable using a cross-sectional time frame between 2015 to 2020 using statistical computations in Microsoft Excel. This chosen methodological framework is replicable without difficulty and provides a simple avenue for establishing a solution to the research question.
From a statistical lens, the Pearson correlation coefficient (Pearson's r) is a simplistic correlation measure between variables; in this sense, it provides a descriptive statistic of the relationships among those variables with little implication of significance. The Pearson's r analysis provides a linear correlation explanation between the data sets using the covariance ratio between those variables and the product of their relative standard deviations.
As visual examinations are subjective, the researcher applies an objective measure to define the correlation. To quantify the nature of the relationship, the researcher uses the linear correlation coefficient: r =(xi-x)(yi-y)(xi- x)2 (yi-y)2
where, r = Pearson Correlation Coefficient, xi = x variable samples, yi = y variable sample, x = mean of values in x variable, y = mean of value in y variable
The linear correlation coefficient or Pearson's r product-moment correlation coefficient defines how strong the linear relationship is between variables and the direction, either positive or negative.
The characteristics of "r":
- It is always between -1 and +1.
- Positive values of "r" = positive relationships.
- Negative values of "r" = negative relationships.
- It is a unitless measure.
However, given the lack of significance, the research relies on the Multiple Regression Analysis framework to reject or accept the null hypothesis (H0) and acknowledge the alternate hypothesis (H1).

H0 = The significance of the correlation coefficient is not significantly different from zero. Hence not significantly linear or depicts any correlation between the Global Innovation Index (GII), the Regulatory Quality Index (RQI), and Government Effectiveness (GE) measure.
H1 = The significance of the correlation coefficient is significantly different from zero. Hence this is a significant linear relationship/correlation between the Global Innovation Index (GII), the Regulatory Quality Index (RQI), and the Government Effectiveness measure (GE).
The multiple regression analysis allows for the relationship between the dependent variable, in this case, GII of Jamaica, and the two independent variables (predictors), RQI and GE.
This model computation is executed using Microsoft excel functions and is displayed graphically for interpretation. The significance level alpha (a) is 0.05; there is a 5% possibility that the researcher will accept the H1 when the H0 is true. The lesser the significance level, the more the burden of proof needed to reject the H0 null hypothesis.
Microsoft Excel will compute the test statistic and associations established between variables considering the 95% confidence level. The p-value defines the probability of finding a sample statistic coincidental if the null hypothesis is true. The p-value results from the test statistic will allow for conclusions about the hypothesis using the p-value against the significance level in the previous statement.
At this point, the data will suggest rejecting the null hypothesis in favor of the alternative hypothesis; if the result is statistically significant if p-value <= significance level (a) =>. Or fail to reject the null hypothesis; therefore, the result is not statistically significant if P-value > significance level (a) =>.
Results
The experiment results and test the correlation and impact of the variables provided the following results. Table 1 shows that Jamaica's Mean (M) Global Innovation index was 29.93, with the mode at 30.4 and the median at 30.15. The result indicates that the data is approximately symmetrical about the mean with a variance of 0.55 and a standard deviation of 7.4. Subsequently, the Regulatory Quality Index (RQI) has a Mean (M) of 0.15 and a median of 0.16, indicating an approximate symmetry about the mean with a variance of 0 and a. standard deviation of 0.04. Finally, Government Effectiveness shows symmetry with a Mean (M) of 68.51, a median of 69.00 with a variance of 5.06, and a standard deviation of 2.25.
Table 1
Statistical Outputs
|
Year |
Global Innovation Index (GII) |
Regulatory Quality Index (RQI) |
Government Effectiveness (GE) |
|
2015 |
29.9 |
0.11 |
64.42 |
|
2016 |
29 |
0.16 |
68.77 |
|
2017 |
30.4 |
0.15 |
69.23 |
|
2018 |
30.4 |
0.2 |
70.67 |
|
2019 |
30.8 |
0.17 |
70.19 |
|
2020 |
29.1 |
0.09 |
67.79 |
|
Statistical Output |
Global Innovation Index (GII) |
Regulatory Quality Index (RQI) |
Government Effectiveness (GE) |
|
Mean (M) |
29.93 |
0.15 |
68.51 |
|
Mode |
30.4 |
- |
- |
|
Median |
30.15 |
0.16 |
69.00 |
|
Variance |
0.55 |
0.00 |
5.06 |
|
Standard Deviation (SD) |
0.74 |
0.04 |
2.25 |
|
Skewness |
-0.39 |
-0.29 |
-1.41 |
Notes: Statistical computations by researcher/author Fisher D. S. (2022) using Microsoft Excel.
Table 2 provides the Pearson Correlation Coefficient output against the three variables. As per the last mention, the result is descriptive; the result is showed that 55.2% of the variation in GII relates to RQI, while 39.4% relates to Government Effectiveness. However, the results also showed that 77.4% of the variations in RQI correlate to fluctuations in GE. In addition to the Pearson's r test, Figure 6 shows the relative disparity in movements of the three variables over time in a descriptive manner.
Table 2
Pearson Correlation Coefficient Computations
|
|
Global Innovation Index (GII) |
Regulatory Quality Index (RQI) |
Government Effectiveness (GE) |
|
Global Innovation Index (GII) |
1.000 |
|
|
|
Regulatory Quality Index (RQI) |
0.552 |
1.000 |
|
|
Government Effectiveness (GE) |
0.394 |
0.774 |
1.000 |
Notes: Statistical computation of Pearson Correlation Coefficient of GII (output variable) versus the predictor variables RQI and GE by researcher/author Fisher D. S. (2022) using Microsoft Excel.
Figure 6
Graphical output of key comparable variables and descriptive correlation of Multiple R
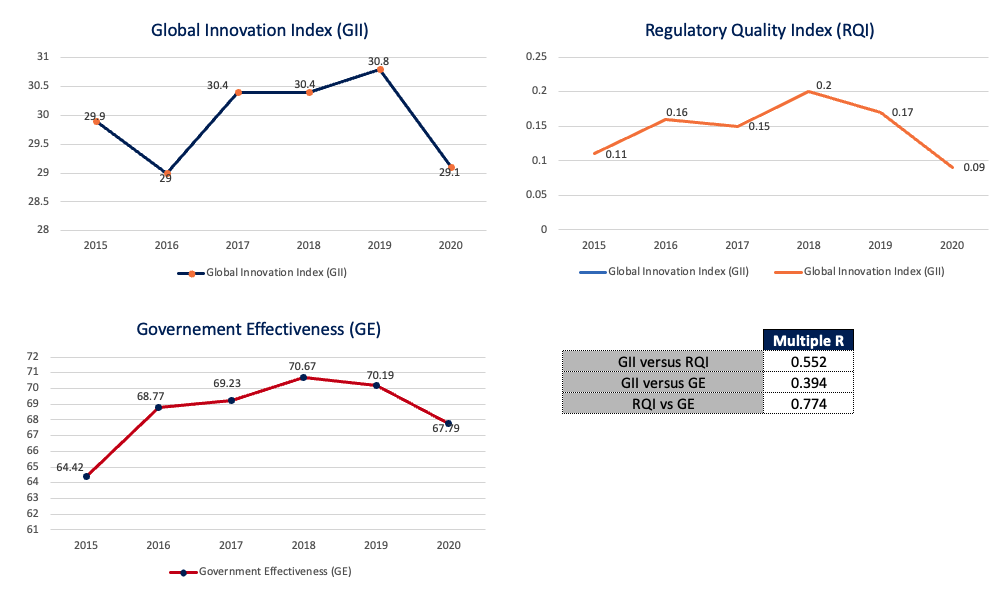
Notes: Graphical output of comparable indexes and the individual Pearson Correlation Coefficient of GII (output variable) versus the predictor variables RQI and GE by researcher/author Fisher D. S. (2022) using Microsoft Excel.
To test the hypothesis above, the output variable and predictor variables used a confidence level of 95% with an alpha level of .05. The multiple regression output is 55.48% and a low R Square of 30.78%. The experiment showed that the p-value for the y-intercept (0.149), RQI (0.476), and GE (0.921) are greater than the alpha level (0.05) (see figure 7). In addition to these results, the significance F (0.576) is also greater than the alpha level. Therefore, the results provide that the test fails to reject the null hypothesis; therefore, the result is not statistically significant if P-value > significance level (a) => (see table 3)
Figure 7
Multiple Regression Analysis Output
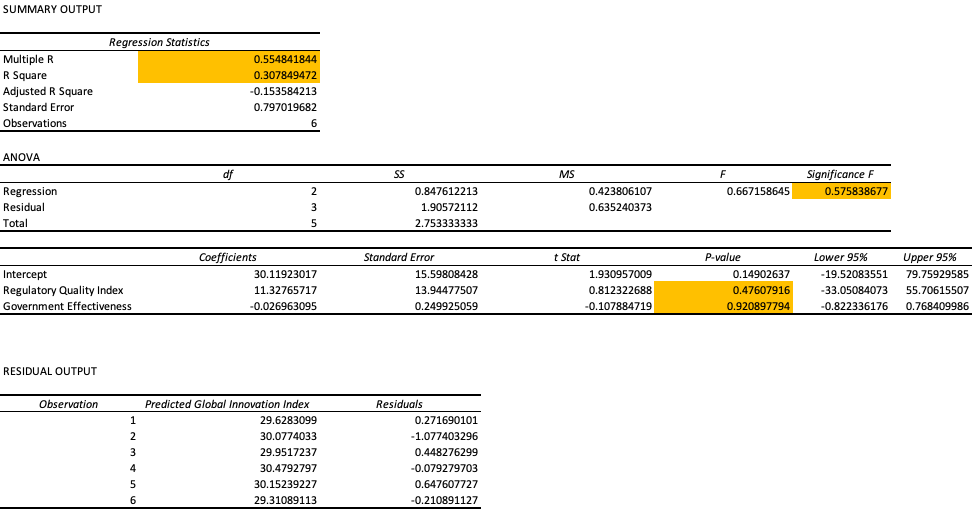
Notes: Computational outputs of Multiple Regression Analysis for GII (output variable) versus the predictor variables RQI and GE by researcher/author Fisher D. S. (2022) using Microsoft Excel Regression Modelling tool.
Table 4
Hypothesis test result
|
|
t- statistic |
p-value |
Significance level alpha |
Criteria |
Output |
|
Null Hypothesis (H0) |
0.812 |
0.476 |
0.05 |
Accept if p-value > significance level (alpha) => |
Accept |
|
Alternate Hypothesis (H1) |
-0.107 |
0.921 |
0.05 |
Accept if p-value <= significance level (alpha) => |
Reject |
Notes: Computational outputs of Multiple Regression Analysis for GII (output variable) versus the predictor variables RQI and GE by researcher/author Fisher D. S. (2022) using Microsoft Excel Regression Modelling tool.
Figure 8 highlights the result of the residual plot, which indicates the suitability of the test model given the randomness of the sample despite the small size; the graph shows no observable trends in the data set.
Figure 8
Residual plot for model validity
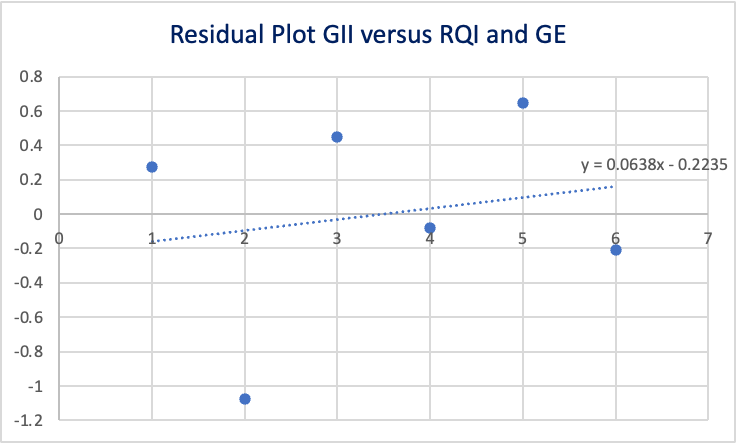
Notes: Computational outputs of Multiple Regression Analysis for GII (output variable) versus the predictor variables RQI and GE by researcher/author Fisher D. S. (2022) using Microsoft Excel Regression Modelling tool.
Discussion
Given the output of the Multiple Regression test, the model fails to reject the null hypothesis. At this point, it means that the significance of the correlation coefficient is not significantly different from zero. Hence not significantly linear or depicts any correlation between the Global Innovation Index (GII), the Regulatory Quality Index (RQI), and Government Effectiveness (GE) measure. Comparatively, the correlation coefficient provides a descriptive narrative that implies correlation. Regarding the Jamaican, innovative environment, the data suggests that government action does not drive the development of the innovative digital economy but instead provides an environment that enables its development. With that, as Jamaican governmental policies create a more conducive environment, the greater likelihood that stakeholders will move to develop the digital economy. This result gives credence to exploring government regulative policies that block the adoption of new and emerging technologies in the business environment. The rhetoric here is that the development of the innovative business environment relies on the actors (businesses, individuals, consumers) versus the actions of the enablers (government).
This assumption, given the experiment aligns with the theories of Hanna (2018), Chen et al. (2021), Vukoszavlyez (2019), and Xanthopoulou and Plimakis (2021), which determine that governments factors influence the adoption of the digital economy through digital transformation by creating engaging regulative frameworks. While the Pearson's r test gives a descriptive annotation to the correlation results, it comes at face value as the underlying relationships do not define causative reactions due to significance levels. As an affirmation to the above experiment, it provides complete confirmation that the Null Hypothesis (H0) is, in fact, valid, and there is no significant underlying correlation between the development of an innovative (digital) business ecosystem and government actions in Jamaica but rather a supportive influence.
Author: Darren S. Fisher
Bibliography
Blind, K. (2011, October 22). The influence of regulations on innovation: A quantitative assessment for OECD countries. Research Policy, 41, 391-400.
Chen, C., Lin, Y. C., Chen, W. H., Chao, C. F., & Pandia, H. (2021, January). Role of government to enhance digital transformation in small business. Sustainability, 13(1028).
Cornell University, I. a. (2013). The Global Innovation Index 2013: The Local Dynamics of Innovation. Geneva, Ithaca, and Fontainebleau.
Cornell University, INSEAD, and WIPO. (2020). Global Innovation Index 2020, Who will finance innovation? Ithaca, Fontainebleau, and Geneva.
Ebert, C., & Duarte, C. H. (2018). Digital Transformation. Retrieved November 2021, from Research Gate: https://www.researchgate.net/profile/Carlos-Henrique-Duarte-2/publication/326241618_Digital_Transformation/links/5b4d14f3aca27217ff9b05e4/Digital-Transformation.pdf
Erik, S. (2008). Entrepreneurship and innovation policy. Jena Economic Research Papers, 2008(006).
Hanna, N. (2018, July 16 ). A role for the state in the digital age. Journal of Innovation and Entrepreneurship(5).
IADB. (2019, September 17). Jamaica to promote innovation, growth, and entrepreneurship ecosystems with IDB support. Retrieved March 2022, from Inter-American Development Bank: https://www.iadb.org/en/news/jamaica-promote-innovation-growth-and-entrepreneurship-ecosystems-idb-support
OECD. (2019). Trade in the Digital Era, OECD Going Digital Policy Note. Retrieved November 2021, from OECD: https://www.oecd.org/going-digital/trade-in-the-digital-era.pdf
The Inter-Academy Partnership (IAP). (2007, October). The role of Government and the contribution of science and technology. Retrieved February 2022, from The Interacademy: https://www.interacademies.org/sites/default/files/2021-03/The%20Role%20of%20Government%20and%20the%20Contribution%20of%20Science%20and%20Technology.pdf
The World Bank. (2022). TCdata360. Retrieved January 2022, from The World Bank: https://tcdata360.worldbank.org/indicators/51ada6ba?country=BRA&indicator=40283&viz=line_chart&years=2013,2020
Vukoszavlyez, S. (2019). The connection between Global Innovation Index and Economic Well-Being Indexes. APSTRACT, 13(3-4), DOI: 10.19041/APSTRACT/2019/3-4/11.
Williams, R. (2022, January 14). Jamaica being positioned as Caribbean Innovation Hub-PM. Retrieved from Jamaica Information Service: https://jis.gov.jm/jamaica-being-positioned-as-caribbean-innovation-hub-pm/
Xanthopoulou, P., & Plimakis, S. (2021, September 15). Digitalization and Digital Transformation and Adoption in the Public Administration during the Covid-19 Pandemic Crisis. European Scientific Journal, (ESJ), 17(31), 60.